
Shopify Conversion Rate Benchmarks 2026 (by Vertical)
Shopify conversion rate benchmarks for 2026, broken down by vertical, device, and traffic source. Real numbers, honest medians, and what to fix first.
In this article
- 01 The headline number#
- 02 Conversion rate by vertical#
- 03 Conversion rate by device#
- 04 Conversion rate by traffic source#
- 05 Funnel stage benchmarks#
- 06 New vs returning visitor benchmarks#
- 07 Cart abandonment as the inverse benchmark#
- 08 Average order value benchmarks#
- 09 Page speed and conversion#
- 10 How to use these numbers#
- 11 What top-decile stores do differently#
- 12 A short summary#
The single most common question we get from Shopify merchants is some version of “is my conversion rate normal?” The honest answer is that “normal” depends on what you sell, who you sell to, and where your traffic comes from. A 1.4% conversion rate on a furniture store is healthy. A 1.4% conversion rate on a beauty subscription store means something is broken.
This post is a 2026 update on Shopify conversion rate benchmarks by vertical, with median, top-quartile, and top-decile numbers, plus the device and traffic-source splits that actually move the average. Numbers are pulled from a sample of roughly 1,200 Shopify stores running Cartylabs in the trailing 90 days, cross-referenced with public Littledata, Shopify, and Klaviyo benchmarks.
The headline number
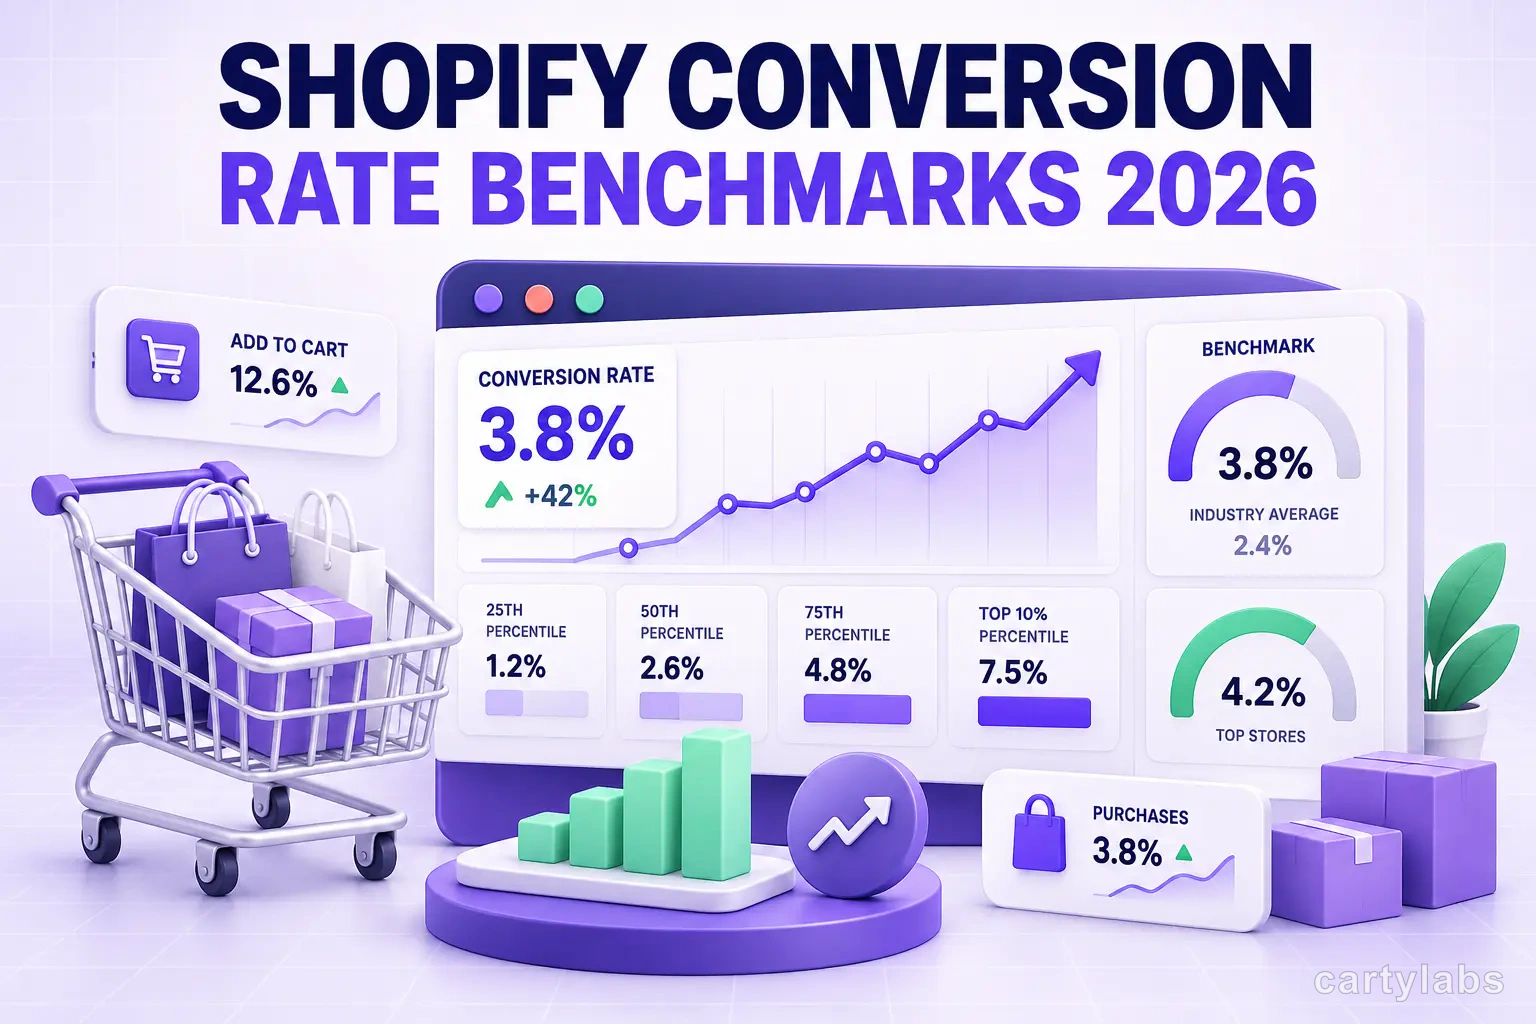
Across all Shopify stores in our sample, the median session-to-order conversion rate is 1.7%. Top quartile sits at 2.9%, top decile at 4.4%. Anything above 5% is statistically rare and usually involves a strong returning-customer skew or a single-product DTC playbook.
If you’re below 1.0%, you don’t have a “conversion rate” problem. You have a traffic-quality, product-market-fit, or page-speed problem masquerading as one. Diagnose those first; tweaking the cart drawer won’t help.
Conversion rate by vertical
| Vertical | Median | Top quartile | Top decile |
|---|---|---|---|
| Beauty / cosmetics | 3.0% | 4.6% | 6.8% |
| Food & beverage | 4.1% | 6.0% | 8.5% |
| Health & supplements | 3.4% | 5.2% | 7.4% |
| Apparel & accessories | 2.0% | 3.3% | 5.1% |
| Home goods | 1.8% | 2.9% | 4.4% |
| Pet | 2.6% | 4.0% | 5.9% |
| Electronics & gadgets | 1.2% | 2.0% | 3.2% |
| Furniture | 0.7% | 1.3% | 2.1% |
| Jewelry | 1.4% | 2.4% | 3.8% |
| Sporting goods | 1.6% | 2.6% | 4.0% |
A few things stand out. Food and beverage consistently wins on conversion because the products are low-consideration, repeat-purchase, and often subscription-anchored. Furniture sits at the bottom because the consideration cycle is long, baskets are large, and most shoppers visit 4-6 times before buying.
If you sell apparel, don’t compare yourself to a coffee subscription. Compare to other apparel.
Conversion rate by device
Mobile makes up roughly 70% of Shopify traffic but only about 55% of revenue. The gap shows up here:
| Device | Median CR | Top decile |
|---|---|---|
| Desktop | 2.6% | 5.8% |
| Mobile | 1.4% | 3.6% |
| Tablet | 2.1% | 4.5% |
The desktop-mobile gap is the single biggest leak in most Shopify funnels. If your mobile conversion rate is more than 40% below desktop, you have a mobile UX problem, not a traffic problem. Our mobile conversion optimization guide covers the specific fixes that close that gap fastest, mostly around tap targets, cart drawer behavior, and one-tap checkout.
Conversion rate by traffic source
Source quality matters more than volume. Median CR by channel:
| Source | Median CR |
|---|---|
| Email (owned) | 4.8% |
| Direct | 3.1% |
| Organic search | 2.2% |
| Paid search (brand) | 5.4% |
| Paid search (non-brand) | 1.6% |
| Paid social (Meta) | 1.1% |
| Paid social (TikTok) | 0.8% |
| Affiliate | 2.4% |
| Referral | 2.7% |
Two patterns are worth internalizing. First, brand search converts at 3-5x non-brand. If your blended Google Ads CR is 2%, you’re being flattered by branded clicks; the non-brand number is probably under 1%. Second, paid social converts low even when it’s working. A 1% CR on Meta isn’t a failure if your cost per click is low and your downstream LTV is healthy. Don’t optimize Meta CR; optimize Meta CAC payback.
Funnel stage benchmarks
Session-to-order is a lagging indicator. The real diagnostic value is in the funnel:
| Stage | Median | Top decile |
|---|---|---|
| Session to product page | 48% | 72% |
| Product page to add-to-cart | 8.5% | 18% |
| Add-to-cart to checkout started | 52% | 78% |
| Checkout started to order placed | 48% | 72% |
Multiply those out and you get the session-to-order number. The two biggest leaks for most stores are product page to add-to-cart (a PDP problem, see our product page best practices guide) and add-to-cart to checkout started (a cart problem, see our cart drawer guide).
If your add-to-cart-to-checkout rate is below 40%, fixing the cart is almost always the highest-leverage change you can make. A drawer-based cart with a clear progress bar and one-tap checkout typically lifts that step 5-12 points on its own.
New vs returning visitor benchmarks
Returning visitors convert at 3-5x the rate of new visitors. That’s not a Shopify quirk, it’s an ecommerce universal:
| Visitor type | Median CR |
|---|---|
| New visitor | 1.2% |
| Returning visitor | 4.8% |
| Logged-in customer | 7.1% |
This is the single strongest argument for investing in customer retention and email marketing. A store doing 60% new / 40% returning at a 1.7% blended CR can move that blend to 50/50 and lift overall CR to 2.4% without changing anything on the storefront.
Cart abandonment as the inverse benchmark
Cart abandonment is the flip side of conversion. Industry-wide it sits around 70%. The Shopify median in our sample is 68%, with top-decile stores at 52%. The math: if you start checkout with 100 shoppers, top operators ship 48 of them. Median operators ship 32. The difference is almost entirely cart UX, shipping cost transparency, and recovery email cadence (covered in our cart abandonment playbook).
Average order value benchmarks
Conversion rate is half the equation; AOV is the other half. Median Shopify AOV by vertical:
| Vertical | Median AOV | Top decile AOV |
|---|---|---|
| Beauty | $58 | $112 |
| Food & beverage | $42 | $89 |
| Apparel | $84 | $165 |
| Home goods | $148 | $310 |
| Electronics | $185 | $420 |
| Furniture | $640 | $1,800 |
| Jewelry | $210 | $580 |
The fastest way to lift AOV without touching CR is in-cart upsells and stacked rewards thresholds. Our AOV upsell strategies guide breaks down the specific moves; for most stores a free-gift progress bar at 1.4-1.6x median order value lifts AOV 8-15% within 30 days.
Page speed and conversion
Speed isn’t a benchmark, it’s a multiplier. Shopify’s own data shows that every 1-second improvement in load time correlates with about a 7% lift in conversion. Our sample agrees: stores in the fastest LCP quartile (under 1.8s) convert 1.6x better than the slowest quartile (over 4s) controlling for vertical.
If your LCP is above 3 seconds on mobile, that’s likely your single biggest conversion lever. Theme bloat, oversized hero images, and too many JavaScript apps are the usual culprits.
How to use these numbers
Three honest rules for benchmarking yourself against this data:
- Compare to your vertical, not the average. A 1.6% CR is below average overall but excellent for furniture.
- Look at the funnel, not the headline. “My CR is low” is not actionable; “my add-to-cart-to-checkout rate is 38%” is.
- Don’t chase the top decile. Top-decile stores often have unfair advantages: brand recognition, repeat-customer skew, or single-SKU focus. Aiming for the top quartile in your vertical is a better goal.
What top-decile stores do differently
Across the top 10% of stores in our sample, four patterns repeat:
- Cart UX is drawer-based, not page-based. No top-decile store routes shoppers to /cart.
- Express checkout is enabled and prominent. Shop Pay, Apple Pay, and Google Pay buttons appear on the PDP and the cart, not just at checkout.
- Returning-customer share is above 35%. They’ve invested in retention.
- Page speed (mobile LCP) is under 2 seconds. Almost no exceptions.
None of those are exotic. They’re just executed consistently.
A short summary
The 2026 Shopify median sits at 1.7%, with top quartile at 2.9% and top decile at 4.4%. Compare yourself by vertical, then dig into the funnel to find the actual leak. Most stores find their biggest gain in either mobile UX or add-to-cart-to-checkout, both of which a modern cart drawer plus express checkout solves cheaply.
If you want to benchmark your own store against these numbers, install Cartylabs free on Shopify and the analytics dashboard will show your funnel against vertical medians, or book a 15-minute audit and we’ll walk through your numbers together.
Next steps
Related Shopify resources
Practical tools and product pages related to this guide.
Keep reading
All articles →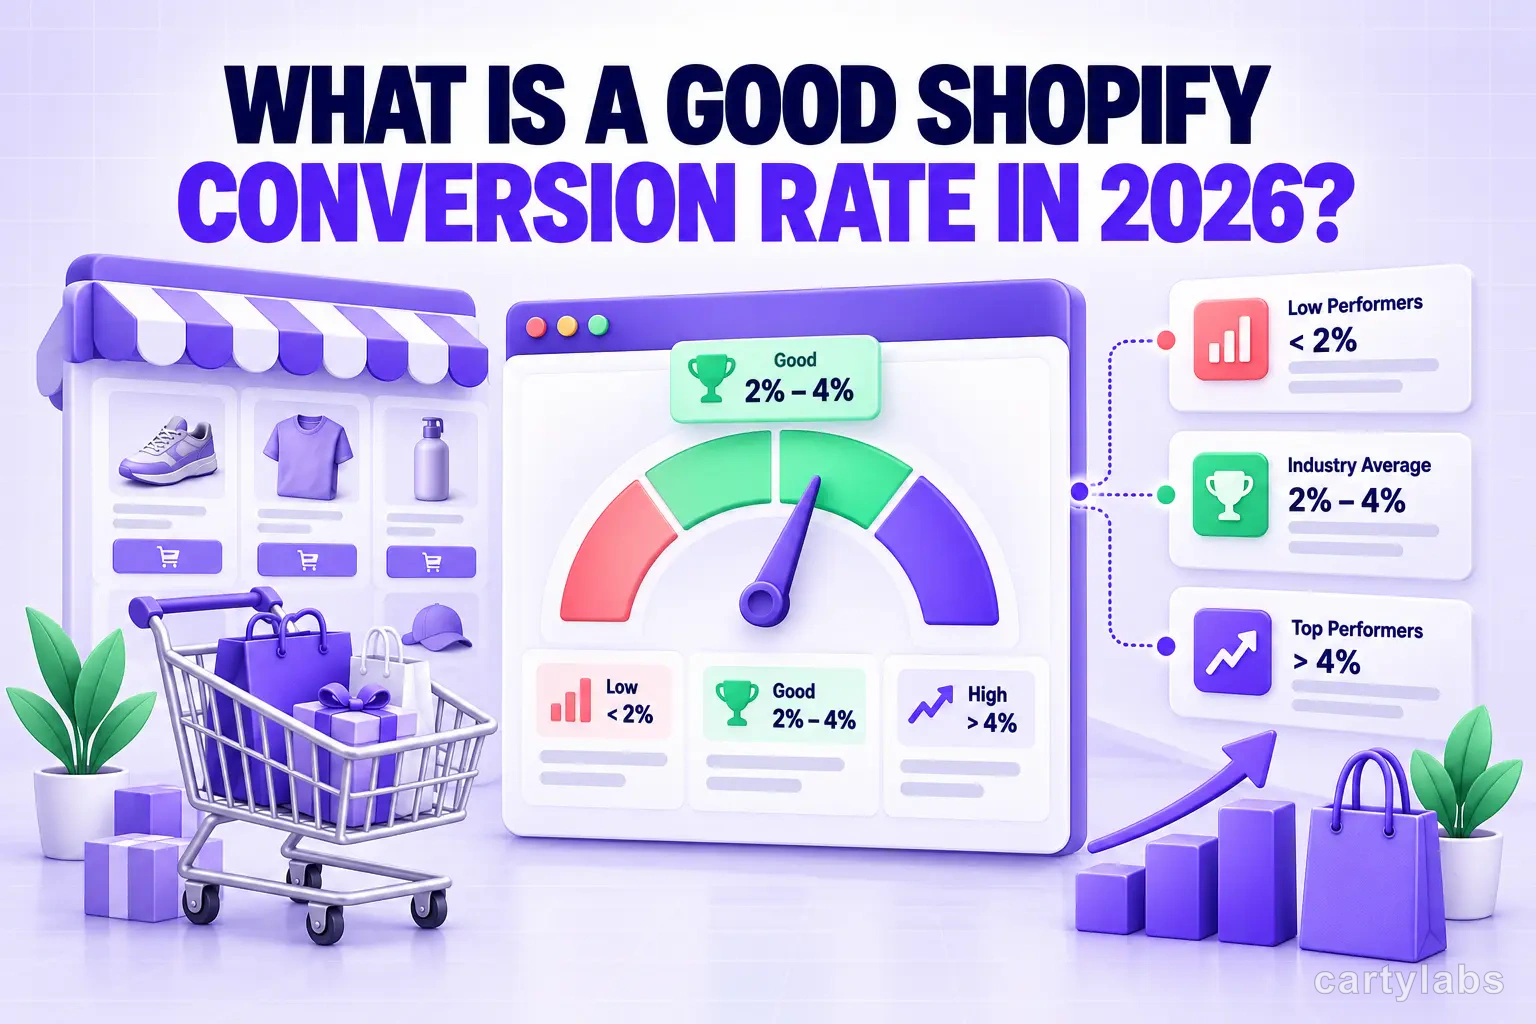
What Is a Good Shopify Conversion Rate in 2026?
A good Shopify conversion rate is above ~3.2% (top 20%); the median is ~1.4%. Benchmarks by device, industry, and funnel stage — plus how to find yours.

Shopify Checkout Conversion Benchmarks 2026: What's Actually Good?
The full benchmark set for Shopify checkout conversion in 2026, by tier, vertical, device, and traffic source. What separates the top 10% from the median, with the methodology behind every number.
Shopify Mini Cart Best Practices (with Examples)
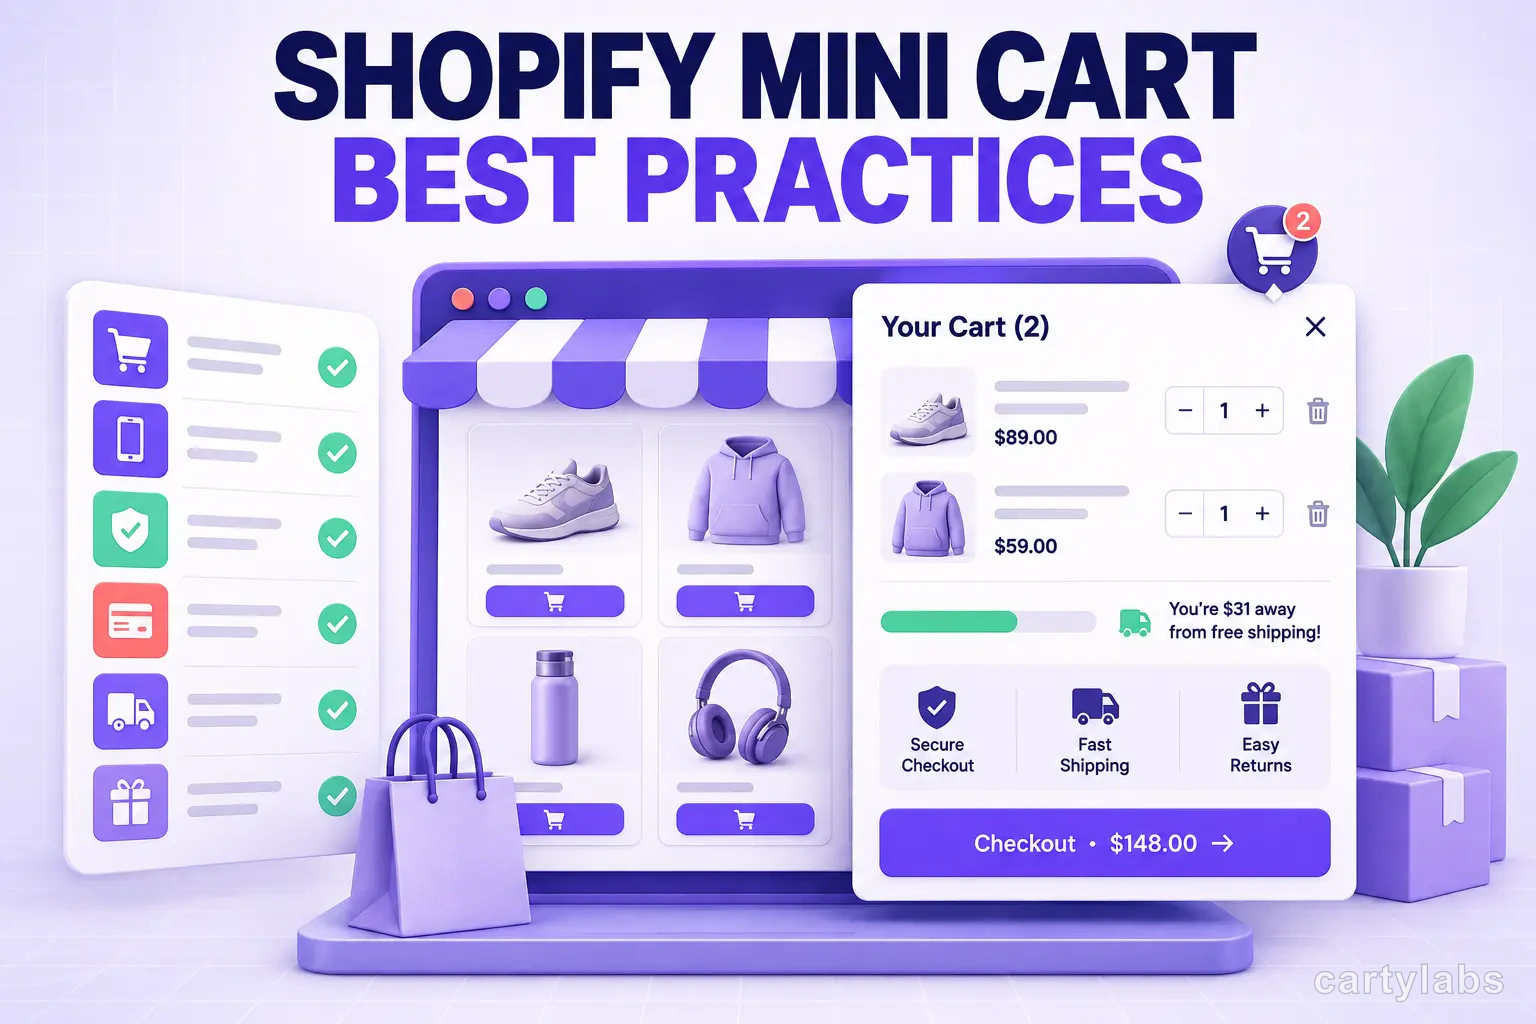
Shopify mini cart best practices: layout, copy, mobile rules, and 12 patterns from high-converting stores. Concrete examples and AOV data for 2026.
 Install Cart — Free